
THE sorry tale of my West Gate Tunnel experiences is a long one. I’ve broken it up into three parts:
- The overall story
- The transport modelling
- The cost-benefit analysis (this post)
In this final part, I’ll cover the heavily distorted cost-benefit analysis and the exaggerated economic value that resulted.
Overview
When my concerns about the Western Distributor (WD) business case were reported in 2017, then-Roads Minister Luke Donellan said in response: “it stacks up, and we’re getting on with it”.
If by ‘stacks up’ he was referring to a positive economic return on investment, he was sorely mistaken. The assertion was based on a flawed and biased business case, produced by the same people who did one for East West Link under the previous government.
The Andrews Government signed up to a project that doesn’t stack up at all, either economically or financially – even without the COVID effect.
The WD business case lumped Transurban’s West Gate Tunnel proposal with other initiatives, which made it look better than it is. It was based on flawed traffic forecasting, and the cost-benefit analysis had some additional distortions. It also misled the Federal Government by misrepresenting Infrastructure Australia’s requirements for economic appraisal.
Including cost increases so far, the economic return of the West Gate Tunnel to Victoria is more like 60-70 cents per dollar invested, not the $1.30-$1.60 stated in the WD business case.
Toll revenue from the West Gate Tunnel would probably only cover about 40% of the capital and running costs. Transurban’s been given additional toll revenue from CityLink, and $2.6 billion of public funding, to make it financially viable. In the appraisal, this was even regarded as a ‘strategic point of difference’ in the project’s favour: that Transurban was the best entity to do the project, because they could leverage CityLink tolls to help pay for it!
Of course, all this would matter a lot more if investment decisions were actually made taking the economic and financial returns into account. The Andrews Government had already decided – even before being elected – that they were going to back Transurban’s proposal. The business case was deliberately distorted to support that decision.
Cost-benefit analysis
The accepted measure of a project’s economic worth is the benefit-cost ratio.
The benefit-cost ratio is essentially the present value of a stream of economic benefits, compared with that of the construction and running cost, over a given period. If it’s more than one (i.e. the benefit stream is worth more than the cost stream) then it’s said to be economically viable. This means that its benefits to the economy are worth more than its costs.
The cost-benefit analysis only includes effects that are ‘monetisable’. This means that they can be translated into something that reflects their impact on the economy, by expressing them in dollar terms.
When cost-benefit analysis was first used in transport, it really only included construction and maintenance costs weighed up against users’ travel time, accident and operating cost benefits. Since then, further research and increased complexity of analysis have led to many other elements coming in. Cost-benefit analyses for transport projects now routinely include allowance for economic effects of transport emissions, induced traffic, network resilience and ‘wider economic benefits’ (which cover effects on jobs and productivity).
The science is still out on wider economic benefits. Because of this, cost-benefit ratios are usually expressed both with and without them. However, recently several other elements have crept which are even more questionable.
Western Distributor business case
The cost-benefit analysis in the WD business case, and the many pages describing the assumptions and methods behind the numbers, shows how complex such calculations can be. Unfortunately, this also makes them pretty opaque to non-specialists (including the end clients for the work, especially the politicians who use the results to ‘sell’ their decisions).
I had the job of reviewing the cost-benefit analysis while it was being prepared, when I was working at the Victorian Department of Economic Development, Jobs, Transport and Resources (DEDJTR) under a contract arrangement.
I was immediately concerned with the quality of the work being done, and I raised several queries about it. My concerns were ignored, and I was taken off the project.
The cost-benefit analysis, and the business case document that surrounded it, were full of so-called ‘optimism bias’. This is a polite term for what I consider to be deliberate distortion to produce a favourable case. It can’t be regarded as an impartial assessment.
The cost-benefit calculations
The centrepiece of the WD business case, the cost-benefit analysis, showed that “The Project” had a benefit-cost ratio of 1.3 to 1.6 (the latter including wider economic benefits) when supposedly done to Victorian guidance. This range became 1.9 to 2.2 when calculated using a misleading interpretation of Infrastructure Australia guidance, as it stood in December 2015.
The table below lists the items making up the costs and benefits to reach this result. You can find the original in the 2015 business case document, reachable via the West Gate Tunnel project page (open the document library under the ‘Library’ menu and keep going down the list until you find it). If you can’t find it, let me know.

Problems with the calculations
There are quite a few problems with the calculations. The biggest ones (not in order of significance) were:
- Misleading representation of Infrastructure Australia guidance: IA guidance was purported to exclude induced traffic effects, which was incorrect. Furthermore, the Victorian and IA numbers were given without any commentary on which might have been closer to the truth; this was unhelpful and misleading.
- Extended project scope: The package of initiatives assessed did not limit themselves to Transurban’s proposal; they included other projects, including the Monash Freeway upgrade east of Warrigal Road.
- Incorrect treatment of induced traffic: The user benefit stream phased in the effects of induced traffic over a full 10 years from opening, thus keeping early-year benefits higher than they should have been.
- Distortions caused by Zenith modelling: Zenith modelling probably overestimates traffic on the West Gate Tunnel by 20-25% (see my previous post).
- Overstated user benefits from congestion relief: Spurious benefits have been added for car users (‘Perceived cost of congested travel time’ in the table above).
- Skewed analysis of network resilience: Calculations that exaggerated the reduced reliance on West Gate Bridge.
- Cost increases since the business case: According to the latest State Budget papers, the cost of the project is now 31% higher than it was in the business case.
I’ll step through these one by one, with my reckoning of the cumulative effect on the benefit-cost ratio.
Misleading representation of Infrastructure Australia guidance
The business case gave two sets of economic figures. One was supposed to be concordant with Victorian guidance, and the other with IA guidance at the time.
The differences were down to three factors. It was claimed that IA guidance:
- called for a 30-year appraisal period, while Victoria’s said 50 years;
- had a different method of calculating residual project value at the end of the appraisal period; and
- did not need allowance for induced traffic (a well-known and widely accepted phenomenon).
Despite using a 30-year appraisal period for IA, the residual value at the end of 30 years was equated to the benefit stream from the next 20 years after that. This was stated to be the recommended method of calculating residual value in IA guidance. Therefore, the IA appraisal appears to have used 50 years’ worth of benefits in any case.
This left the treatment of induced traffic as the only real difference between the two sets of numbers.
I reviewed IA’s guidance at the time over the induced traffic issue. Whilst there was no specific mention of it in the main text, an appendix clearly said that it should be included (or reasons given why not). Furthermore, there was a draft revision of the guidance available at the time (adopted soon afterwards) that clearly said, up-front, that induced traffic must be accounted for.
The reason given for using IA figures was to enable comparison with other supposedly IA-compatible project benefit-cost ratios. No attempt was made to ascertain whether all other projects presented to IA had excluded induced traffic.
Furthermore, the report didn’t comment on whether one set of guidance was better than the other. No professional opinion was given either way. Given the wide range of the results, how does this help the decision makers?
Induced traffic is a well-known phenomenon. No benefit-cost ratio should be without it these days, unless the project is so small or unusual that it doesn’t generate additional travel and mode shift. This is certainly not the case for a large road project.
As the numbers themselves illustrate, ignoring induced traffic increases the benefits by about 63%.
We can safely ignore the ‘IA guidance-compatible’ figures as pure fiction. I only hope that IA did the same.
Extended project scope
The WD business case assessed a package of initiatives bundled together:
- West Gate Freeway widening
- The new Western Distributor
- Cycling and pedestrian facilities
- Webb Dock access road improvements
- Monash Freeway upgrade
Transurban’s ‘market-led proposal’ comprised items 1 and 2 only. The others were included as necessary accompanying works, which is reasonable for items 3 and 4. However, item 5 (the 40 km-long Monash Freeway upgrade) is 20-60km away from the West Gate Bridge, in the eastern suburbs. The influence and interrelationship between the two initiatives is very small, and the justification for including it in the business case is tenuous.
Further down in the business case, a series of sensitivity tests indicate that the BCR of the Monash upgrade is 4.2, while that of the remaining initiatives together is 1.1. I estimate, for this to be true, the cost of the Monash upgrade would’ve been $220 ± 55 million in present value, equating to $350 ± 90 million in nominal dollars (the spread in these numbers allows for a range to the rounded-off benefit-cost ratios in the business case).
Effect on the benefit-cost ratio: reduced from 1.3 to 1.1.
Dubious treatment of induced traffic
The phenomenon of induced traffic is well known. When a new road is opened, it not only attracts re-routed traffic, but also gives rise to new trips.
In 2011, the Victorian Auditor-General provided a useful definition of six different ways that a road project can attract traffic, reproduced below. I’ve added which of these are included in the traffic modelling for West Gate Tunnel.
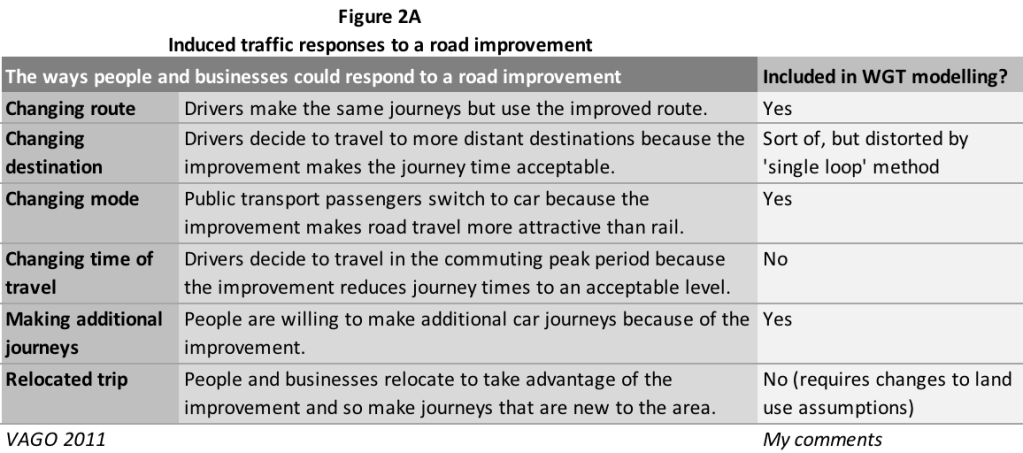
Like most four-step models, Zenith as used on the West Gate Tunnel doesn’t calculate either changes to time of travel (at least, not those who move from one modelled time period to another) or changes in land use patterns resulting from a project. It does cover the other types of induced traffic, but with distortions because of its illogical methodology.
Induced traffic is generally quite a small component of total traffic, but it has a large effect on the benefit stream because of the added congestion it can cause.
The business case explains how induced traffic was accounted for in the cost-benefit analysis. It was done by using a ‘fixed matrix’ (i.e. no induced traffic) approach in year 1 and a ‘variable matrix’ (i.e. including induced traffic) approach in year 10. In years 2-9, the benefit stream was calculated by interpolating between the two.
A graph was provided in an early draft of the business case to illustrate this approach (see below). Note that the blending between ‘fixed’ and ‘variable’ outputs means that the benefits in early years are much higher than if ‘variable outputs were used from the outset.
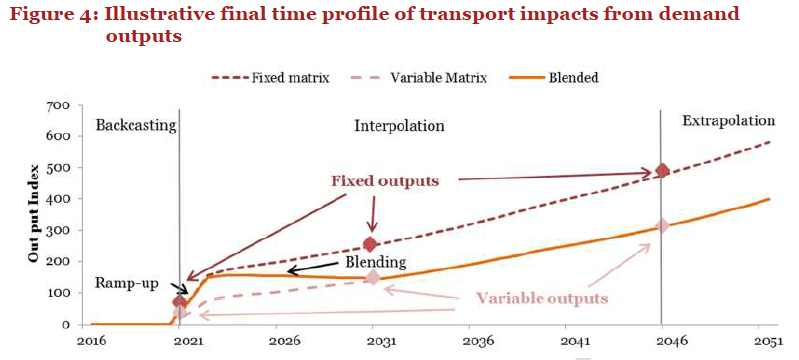
I think that 10 years is highly excessive for this blending assumption. The Zenith modelling doesn’t take account of the land use effect; the other, included forms of induced traffic generally take much less than 10 years to materialise.
I consider 3 years is more realistic (I’ll devote another post to this soon), and I’ve been able to simulate the effect that this would have on the benefit stream, as shown below. It reduces the present value of the benefits by 7%.

Effect on the benefit-cost ratio – reduced from 1.1 to 1.02.
Distortions caused by Zenith modelling
As explained in my previous post, the traffic modelling for the project contains significant distortions. I reckon that these result in a 20-25% overestimate of traffic using the West Gate Tunnel. The effect of this can be looked at in two ways, either by assuming slower traffic growth (and hence lower benefits) over the life of the project, or by factoring the benefits down by a suitable percentage.
In the absence of properly-done traffic modelling, I’ve chosen to reduce the benefits by 15%. This probably equates to about 5-6 years of traffic growth.
Effect on the benefit-cost ratio – reduced from 1.02 to 0.87.
Overstated user benefits
There was a strange item on the benefit list – the so-called ‘perceived cost of congested travel time’.
This significant item was 12% of the benefit stream. It has since been included in Victorian economic appraisal guidance, but I seriously question its validity, and the method of calculating it.
The WD business case contains a lot of discussion about it, essentially arguing that drivers will place a higher value on their travel time when they’re in congested traffic, and that this extra value is proportionally added to the modelled travel time savings when a road reaches a volume-capacity ratio of 70%, reaching its maximum when the volume-capacity ratio is at 100%.
I have several problems with this method.
- The choice of the additional perceived value ($5.30, or about 30% of the underlying value of travel time) is based on surveys done in Sydney in the early 2000s. Arguably, congestion was less widespread then and may have been less ‘accepted’ than it is today, yet no attempt was made to verify the value that might apply in Melbourne conditions in 2015.
- The assumption that it kicks in when traffic reaches 70% of the road capacity and increases linearly from there to 100% is extremely arbitrary. Like most of its type, Zenith doesn’t explicitly model road intersections (the source of virtually all traffic congestion in urban areas); the theoretical capacity of the road network is simulated by using speed-flow curves. There’s no proof that congestion (of the type that supposedly increases perceived costs) starts at a volume-capacity ratio of 70%.
- Most important of all, if this was indeed a real perception, then it ought to have been included in the traffic modelling as well. The reality is that the traffic model is supposed to be calibrated to reflect observed behaviour, so the user costs that come out of it already take full account of the perceived value of times and costs associated with travel, congested or not.
It’s completely illogical to add this extra item of benefit into an economic appraisal derived from a behaviour-based transport model like Zenith.
I therefore think this item should be removed from the benefit stream, at least until it can be categorically proven to be outside the benefits already implicit in the traffic model, and to exactly what degrees of congestion it applies, in Melbourne.
Effect on the benefit-cost ratio – reduced from 0.87 to 0.76.
Skewed analysis of network resilience
The assessment of network resilience is based on estimating how often the West Gate Bridge suffers a typical, significant traffic-delaying incident, and the likely disbenefit associated with such an event.
The busines case has some extreme hyperbole about this. Apparently, a major incident on the West Gate Bridge “can … generate congestion across the entire road transport network” and “… would be calamitous for the economy”. I think we can all agree that these are serious exaggerations.
This aside, the analysis implicitly assumes that the West Gate Tunnel:
- will substantially reduce the effects of such incidents; and
- will be free of any such incidents itself.
These are both clearly untrue. I’ve been a little generous, though, and only reduced this benefit by 50% instead of removing it altogether.
Effect on the benefit-cost ratio – reduced from 0.76 to 0.73.
Cost increases since the business case
Since the business case in 2015, the cost of the initiatives has increased significantly.
In the WD business case, the total nominal-dollar cost of the project was $5,226 million.
In the 2019/20 State Budget, the costs total $6,646m, broken down as follows:
- West Gate Tunnel: $6,302m
- Webb Dock access: $61m
- Monash Freeway upgrade: $283m (I’ve excluded Stage 2 of this, which costs another $684 million in the budget but has since blown out even more).
Excluding the Monash Freeway upgrade, this is a 31% increase in project costs.
Effect on the benefit-cost ratio – reduced from 0.73 to 0.56.
Assuming that wider economic benefits remain the same proportion of total benefits for the project, the benefit-cost ratio including WEBs would be 0.72.
Conclusion
The benefit-cost ratio in the WD business case suggested the project would return $1.30-$1.60 to the Victorian economy per dollar of cost.
Removing the unwarranted inclusion of the Monash Freeway upgrade, the biggest distortions and optimism bias would reduce this to $0.60-$0.70 for the Transurban project elements (West Gate Tunnel and West Gate Freeway widening).
There’s no doubt in my mind that the West Gate Tunnel will not return a positive effect on the Victorian economy.
What’s more, it doesn’t even stack up financially; Transurban needed State funding as well as ramped up and extended tolls on CityLink to pay for it.
We’ve been sold a pup.


Leave a comment