
Summary
The social cost of crashes is huge. From 2000-2022, I estimate that crashes cost the Victorian community $120 billion; the costs are running at about $5 billion a year.
Nationally, society bears $30 billion a year, but data and strategy focus on road deaths alone, which account for only 10% of this cost.
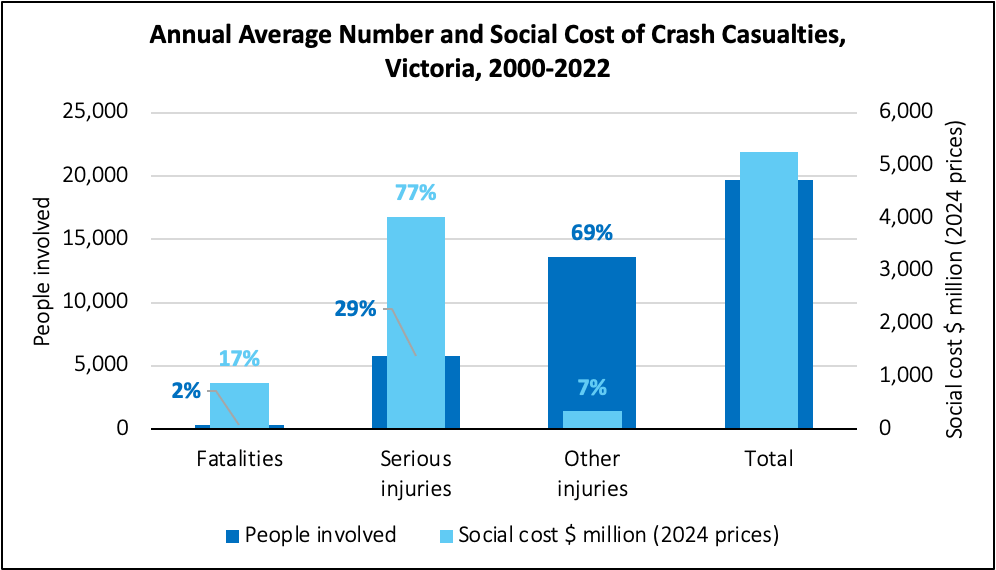
In Victoria, 77% of the social cost of crashes is incurred through serious injuries (needing hospital treatment), and another 7% with ‘other’ injuries. Only 17% is incurred through fatalities.
Developing safety initiatives based solely on the impact of fatalities ignores 80-90% of the social consequences of road crashes. What’s more, fatalities are relatively small in number and inherently random in occurrence, which makes them the worst measure of road safety initiatives’ effectiveness.
Instead of reporting the number of deaths and trying only (and ineffectively) to act on them, policymakers should urgently shift to accounting for the overall social cost of crash casualties (especially serious injuries) and responding to that instead.
The initiative is clearly with State and Territory governments. In Victoria, for example, local government-managed roads are 70% of network-km, but they account for only a third of the social cost of crashes. Moreover, States and Territories set road and vehicle rules and penalties and police them, and they also manage health resources which deal with most of the consequences.
Background
I’ve long been concerned that the policy response to road trauma in Victoria – and indeed Australia – is misplaced, with its concentration (at least anecdotally) on deaths rather than injuries, regional rather than metropolitan areas, and high-speed rural roads rather than lower-speed urban ones.
Since the State Government restarted issuing road crash data (CrashStats) for analysts in late 2023, I’ve been looking at the stats to gain some insights.
About CrashStats
Overall, analysis of the latest 23 full years of data (2000-2022; more recent data is online, but I need time to post-process it before reporting on it) produces the following:
- There were 342,000 reported road crashes in Victoria
- 246,000 (72%) of were in metropolitan Melbourne, and 96,000 (28%) were in the rest of the state
- They involved 841,000 people directly, with 6,800 fatalities, 133,000 serious injuries, 314,000 ‘other’ injuries and 387,000 not injured
- The social cost (using the hybrid human capital cost, more on this below) of these crashes totalled $121 billion in 2024 dollars. 64% of this was from crashes in Greater Melbourne, and 36% in the rest of the state. Moreover, 77% of the social cost was from serious injury crashes, with 17% from fatal crashes and 7% from ‘other’ injury crashes.
This last point is particularly important. Although the social cost of a crash fatality is high (about $3 million each, in 2024 dollars), they only constitute 1.5% of casualties. 29% of crash casualties incur serious injuries (social cost $700,000 each), so their aggregate social cost is 4.5 times that of fatalities. 62% of crash casualties incur ‘other’ injuries (social cost $25,000 each) and only constitute 7% of the social cost of crashes.
CrashStats, despite being quite comprehensive and detailed, doesn’t provide any information on two key causative factors: drug/alcohol influence, or vehicle condition. This is a major omission and an impediment to meaningful independent research. Furthermore, CrashStats only covers crashes that police attended. TAC hospital claims figures for 2000-2022 show there are 5% more injuries involving hospitalisation than CrashStats contains, so this is not a huge issue.
Social cost of crashes
Most countries use a ‘willingness to pay’ (WTP) approach to estimating the social cost of crashes (I’ll use SCC for short). Australia is one of few countries that use a ‘human capital cost’ approach, which in recent years has included WTP elements and is termed a ‘hybrid human capital cost’ approach. This estimates the health, work lost, quality of life, legal, insurance, vehicle, delay and emergency service costs involved in a crash.
SCC is a useful way of assessing crash impact, despite the debate over the approach used to estimate it. It certainly reflects the high social cost of fatalities, but it also brings serious injury crashes to the forefront, because there are many times more serious injuries than fatalities.
Australian Transport Assessment and Planning (ATAP) guidance gives a range of values for social cost; I’ve used the aggregate, Australia-wide figures and updated them to 2024 prices (using the same method that ATAP uses, to update them from earlier years), which results in the following values for social cost:
- Fatality: $2,973,000 per person
- Serious injury: $698,000 per person
- Other injury: $25,500 per person
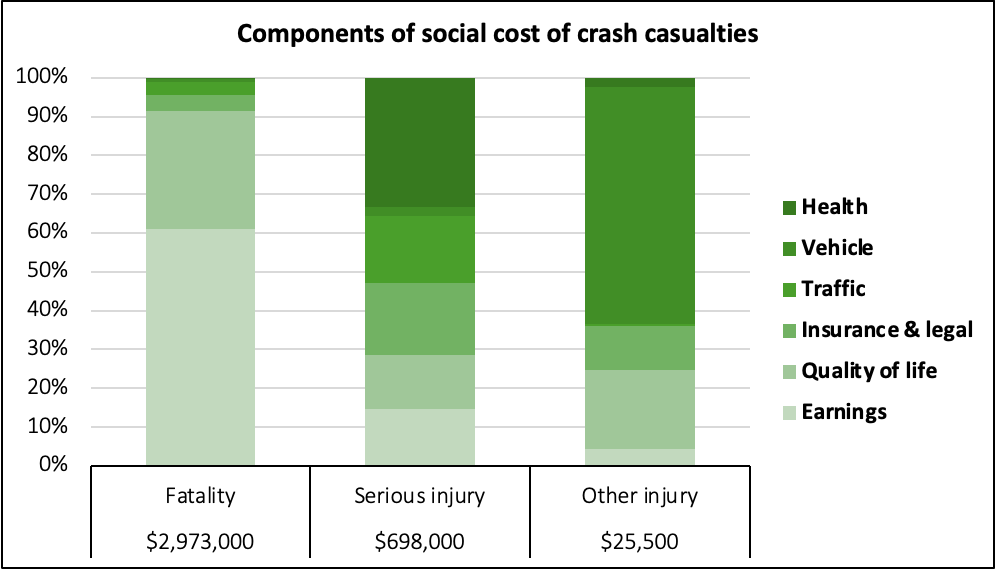
As shown above, a fatality’s highest SCC component is lost earnings, followed by quality of life. A serious injury has a large health component, while a non-serious injury is mainly comprised of vehicle costs.
Incidentally, these cost components haven’t been reviewed for nearly 30 years; they’ve only been updated to later years using a mix of price indices. They’re well overdue for updating (ATAP please take note!).
In the rest of this post, I’ll use the SCC as the main measure. I think this is much more informative than only concentrating on the fatalities, as the media, police and politicians tend to do.
Australia-wide
Nationally, there are about 1,000 fatalities and 40,000 serious injuries a year at the moment.
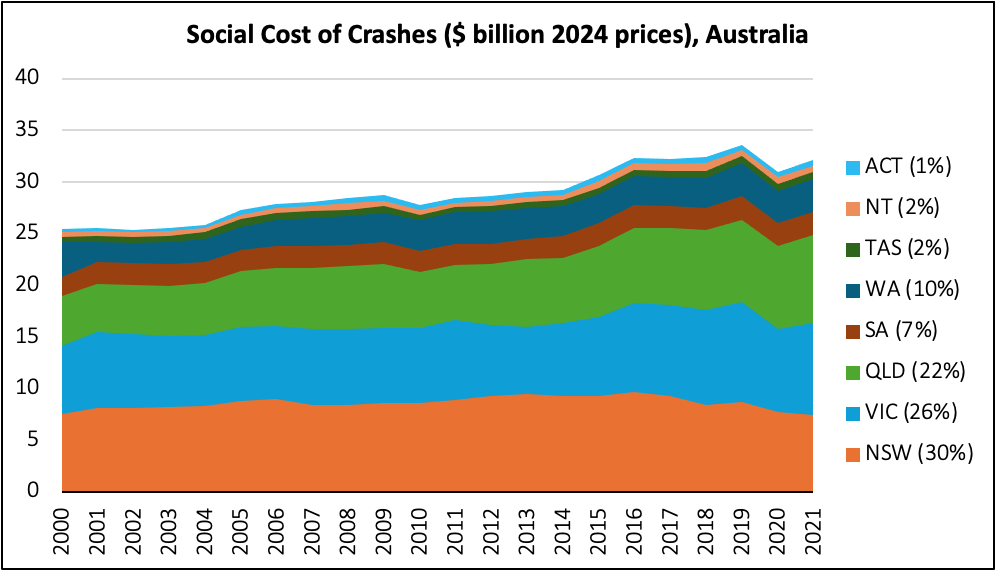
As shown above, the Australian SCC exceeds $30 billion a year in 2024 prices. To arrive at this figure, I’ve used national road crash trauma data from BITRE, which differs a bit from the analysis for Victoria that follows.
Victoria accounts for 26% of the national SCC. It also appears that Victoria and Queensland are the main contributors to the continuing increase in SCC annually; NSW’s SCC has been steadily reducing since 2016, and the smaller jurisdictions only incur 22% of the national SCC between them. The reasons for this need further analysis and thought. Does their lack of roadworthiness testing play a part?
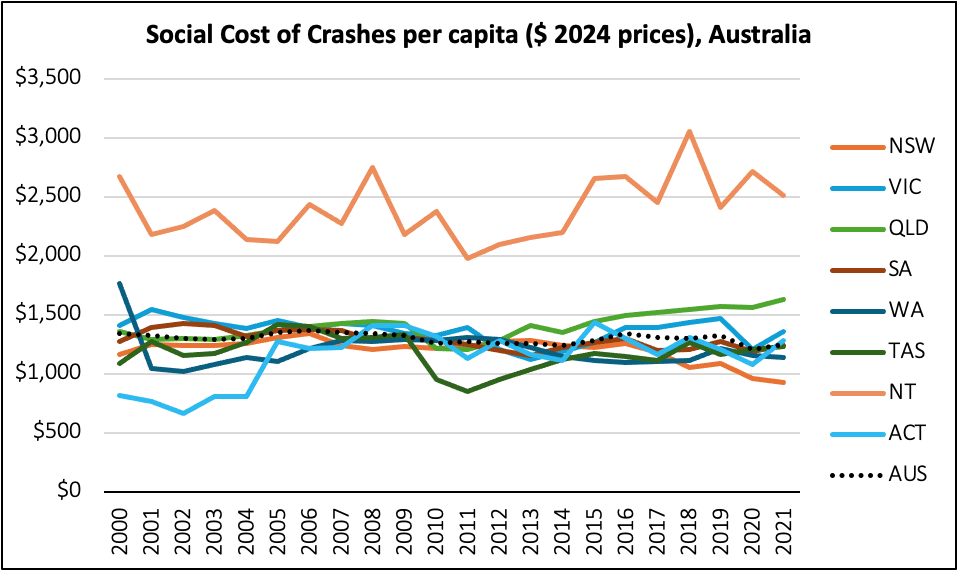
The Northern Territory has significantly higher SCC per capita (about $2,500 per capita annually) than any other jurisdiction; all the other jurisdictions incur SCC of about $1,500 per capita each year. The per-capita SCC has stayed remarkably constant over time everywhere, except in NT. Are their maverick road rules the culprit?
Victoria: casualties and SCC
The annual average SCC was $5.3 billion between 2000 and 2023.
77% of this was incurred through serious injuries and 17% through fatalities. This a compelling reason to look at SCC incurred rather than only fatalities. Whilst road deaths are tragic (and mostly avoidable), serious injuries affect many more people, and they bear the consequences over many years. They also impose high costs on the health system.
Reducing serious injuries could potentially have a much greater effect on crash social costs than reducing fatalities.
Trends
Crashes and their consequences
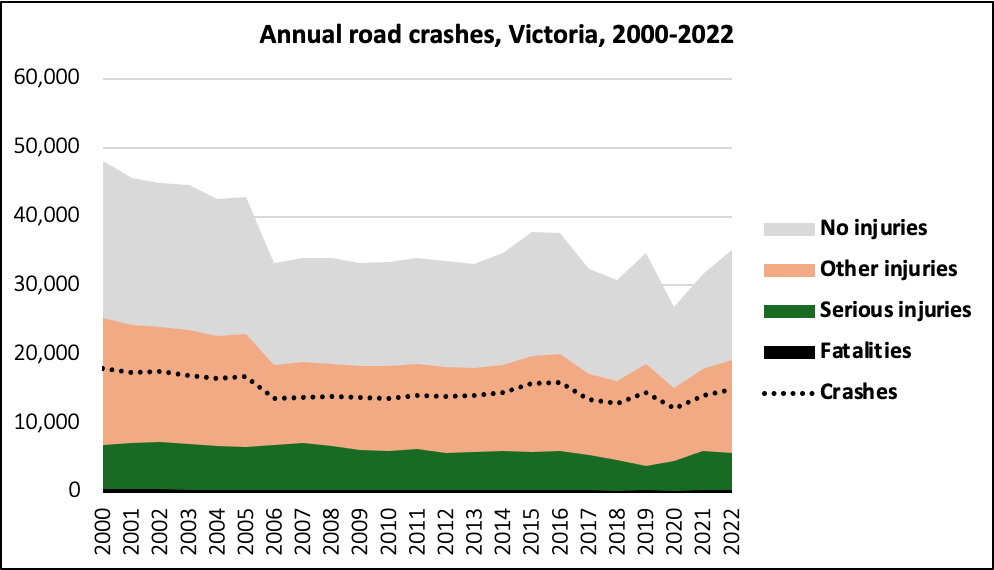
CrashStats crashes have been steadily – but slowly – reducing (this is at odds with BITRE data used for the national snapshot). Note that the large reduction in 2006 is likely due to a change in the reporting approach, rather than a real reduction.
The dip in 2020 was due to COVID lockdowns, when much fewer people were out on the roads. The sharp increase in 2021 and 2022 is of concern and has unfortunately continued since then.
Social costs of crashes
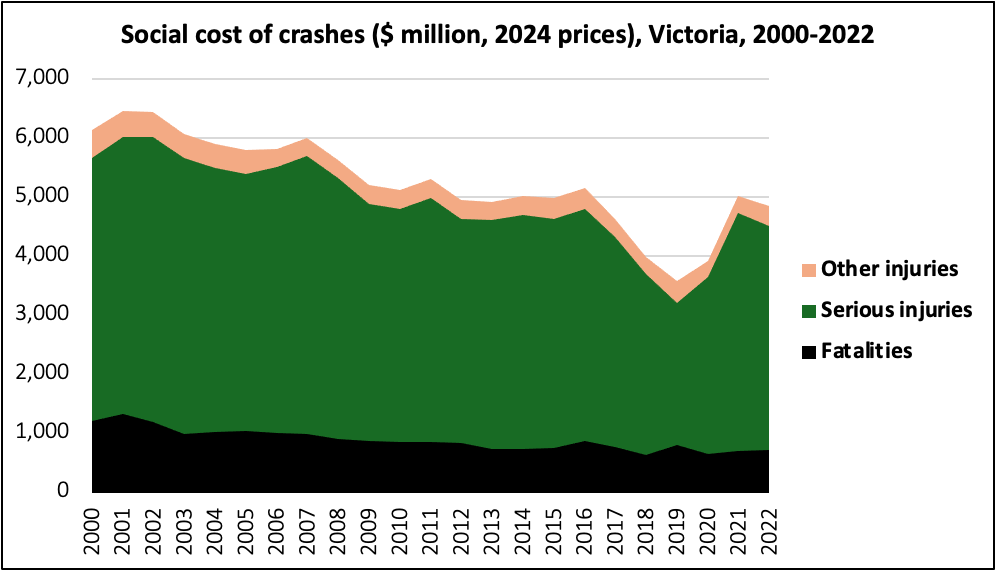
This graph shows similar trends to overall crashes and casualties, with a notable drop in SCC of serious injuries (but only a slight reduction in the costs of fatalities) from 2016 to 2019 (i.e. pre-COVID).
SCC runs at about $5 billion a year. This is a large impact on the Victorian community and is mostly associated with serious injuries rather than fatalities.
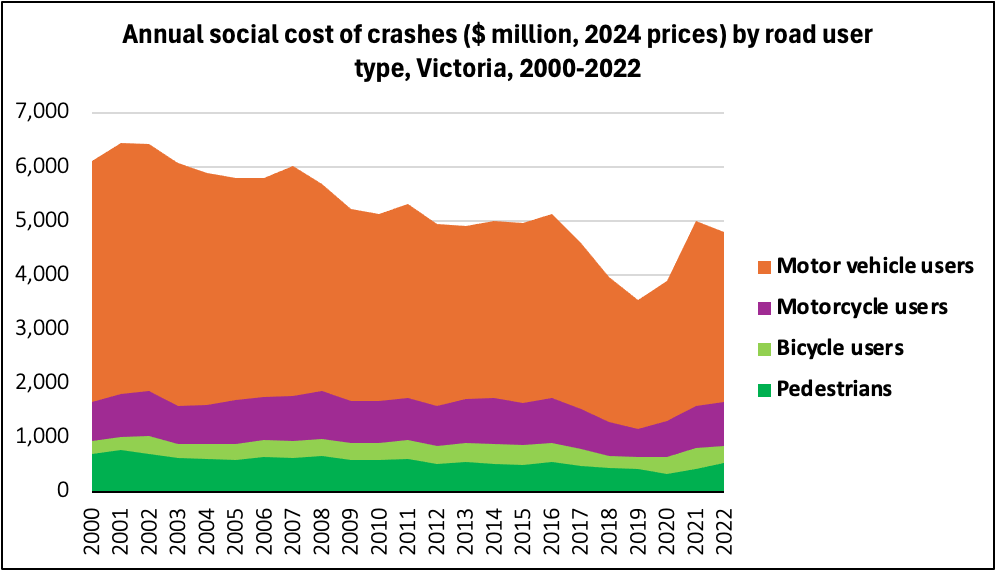
Motor vehicle users incur 69% of SCC (about $3.6 billion on average per year). The annual SCC fell steadily from 2000 to 2016, then dropped substantially to 2019, but since COVID it has risen again almost to 2016 levels. SCC incurred by pedestrians also decreased steadily, but that for bicycle users has stayed more or less constant, if anything it has risen slightly with time.
Pedestrians and bicycle users together incur 17% of SCC, which averages about $875m a year. Motorcycle users incur 14% (averaging $760m/year).
Social cost of crashes – distribution
By road type
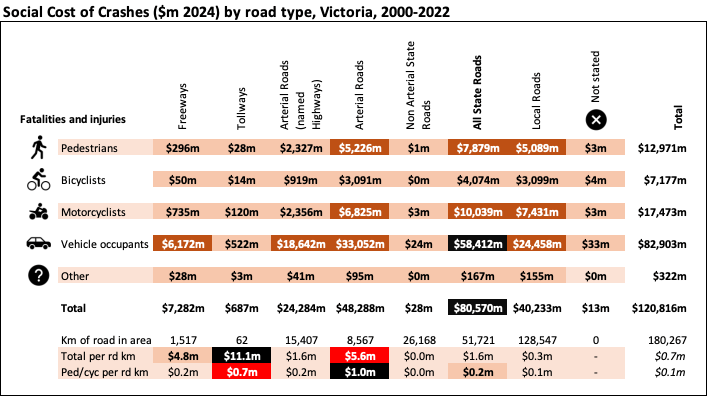
Tollways incurred the greatest SCC per km (around $11m), and arterial roads and freeways ($5.6m/km and $4.8m/km respectively) were next. Overall, State-controlled roads incurred 67% of SCC whilst only being 29% of length.
Local roads (71% by length) only incurred 33% of SCC.
By speed zone
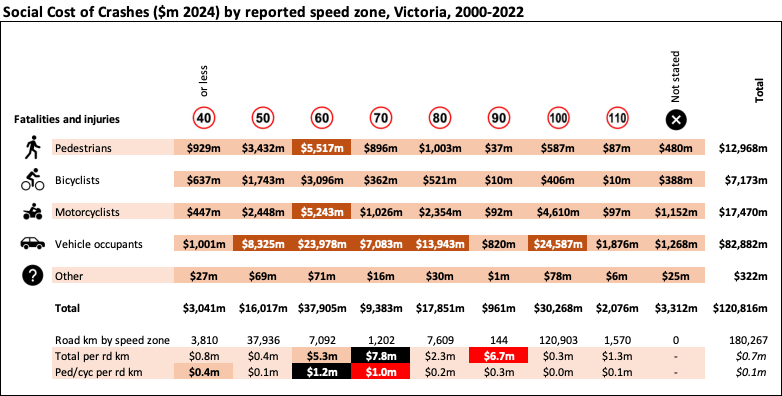
70% of SCC is on roads with speed limits of 80km/h or less, despite being only 30% of road length. Furthermore, over 90% of pedestrian SCC is on roads with speed limits 80km/h or less, being concentrated mainly in urban areas.
Melbourne compared to Regional Victoria
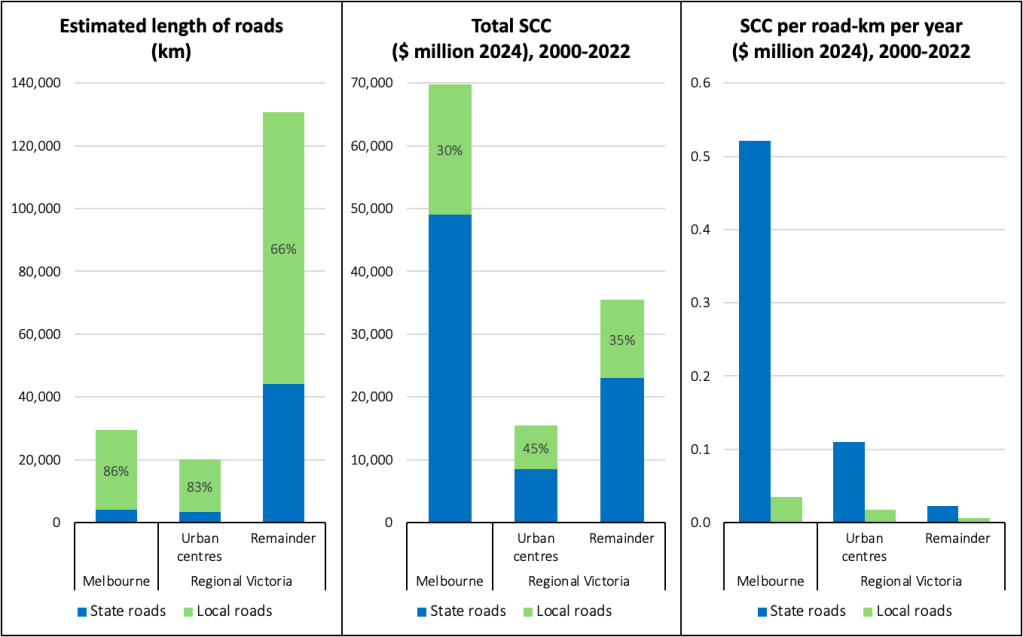
Local roads are 86% of the network length in Melbourne and 83% in regional urban centres, but only 66% of length in the rest of the state. However, they only carry 30% of the crash social costs in Melbourne, 45% in urban centres outside Melbourne, and 35% in the rest of the state.
This results in much lower annual average SCC/km of local roads than state roads. Annual SCC/km are much higher in Melbourne than elsewhere, with state roads over $500,000/kmpa compared to local roads at $35,000/kmpa.
In regional Victoria, roads in urban centres are only 16% of road length but incur 36% of SCC. State roads in regional urban centres have SCC/kmpa of $110,000/km compared to local roads with $18,000/kmpa.
Roads outside urban centres have the lowest SCC/kmpa in Victoria. State roads incur $23,000/kmpa compared to local roads at $6,000/kmpa.
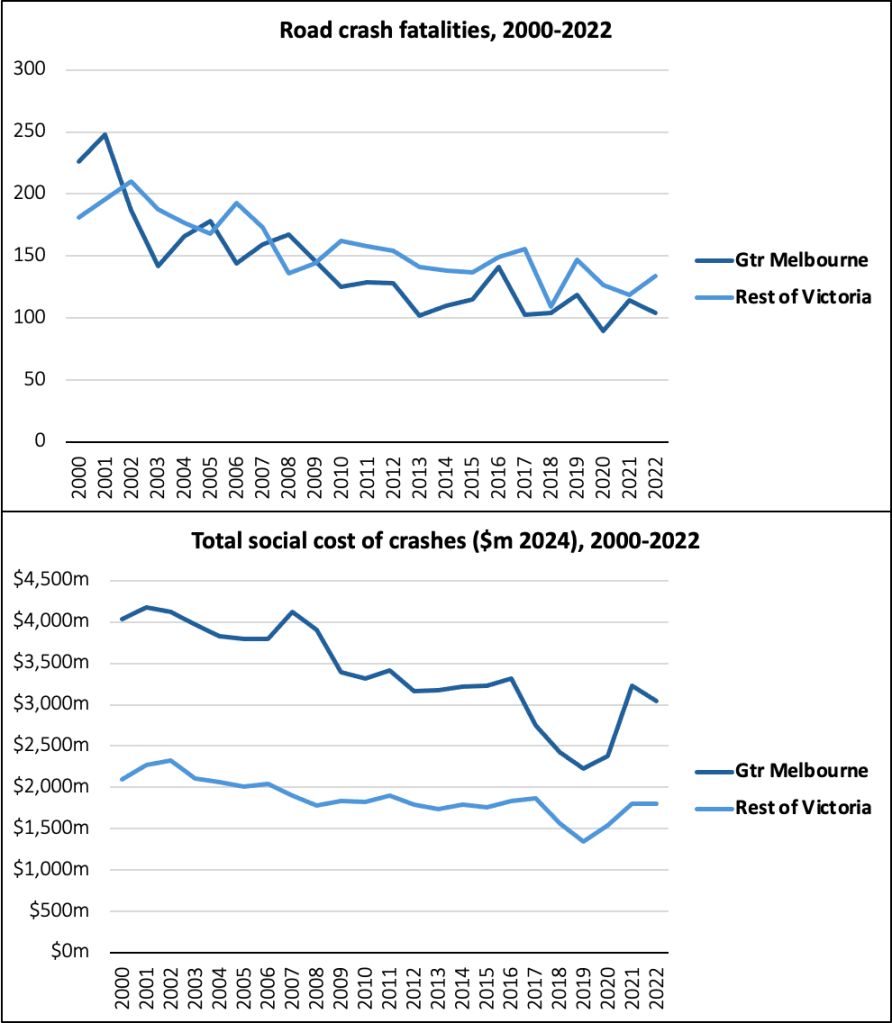
Whilst there are more crash fatalities in regional Victoria than Greater Melbourne, the difference is not as stark as you might think, if you listen to police, politicians and the media. Furthermore, regional Victoria fatalities have only exceeded those in Melbourne consistently since 2009.
The prevalence of serious injuries means that SCC has stayed higher in Melbourne than outside (since 2000 at least). The gap has been narrowing somewhat; Melbourne’s SCC was 93% more than the rest of Victoria’s in 2000, and 69% more in 2023.
Distribution between LGAs
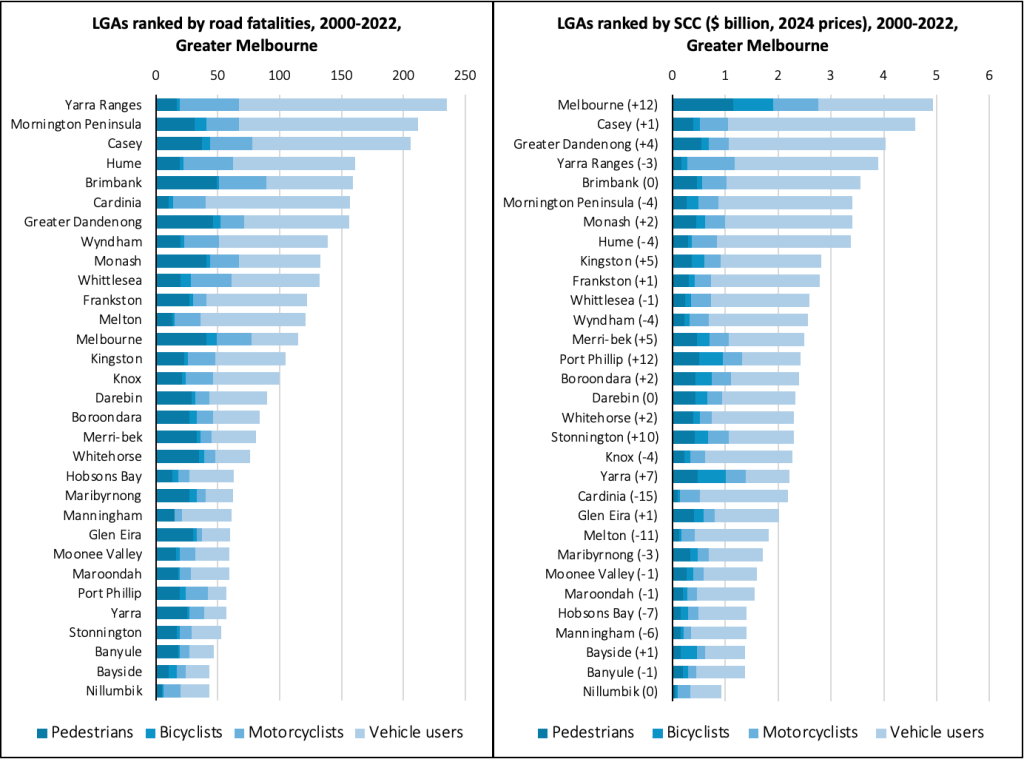
The graphs above rank LGAs in Greater Melbourne by fatalities and SCC respectively. The SCC graph also shows how much the ranking of each LGA changes from that of fatalities.
The City of Melbourne has the highest SCC in Greater Melbourne. What’s more, nearly 40% of SCC is attributed to pedestrians and cyclists there. It’s notable that the inner-area LGAs of Port Phillip and Yarra also have a high proportion of pedestrian and cyclist SCC.
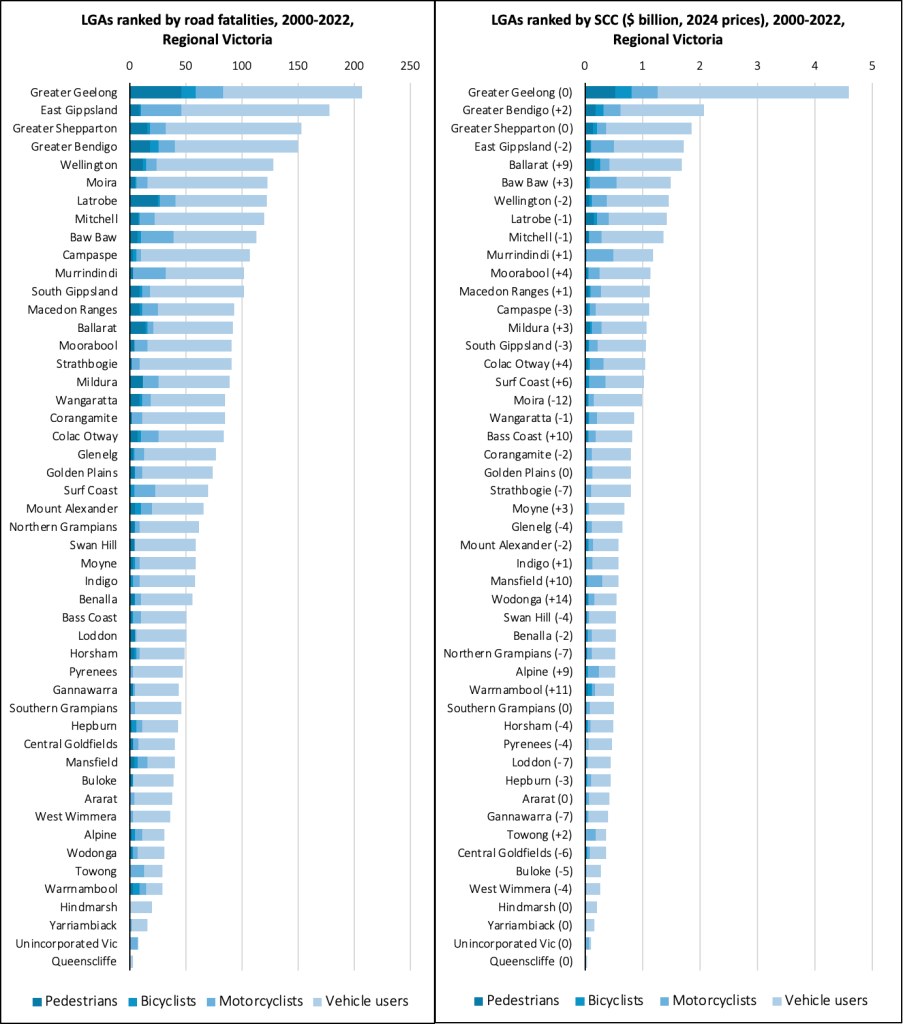
The comparison for regional Victoria (above) is less striking; larger and/or more urbanised LGAs have the highest fatalities and SCC, with smaller differences in the ranking than in Greater Melbourne. Ballarat ranks significantly higher for SCC than fatalities, as do Moira, Bass Coast, Mansfield, Wodonga, and Warrnambool (all lower down the list).
Geelong stands out at the top of the list, having more than double the SCCs of Bendigo in second place. Its SCC of $4.5 billion would put it third highest on the list for Greater Melbourne.
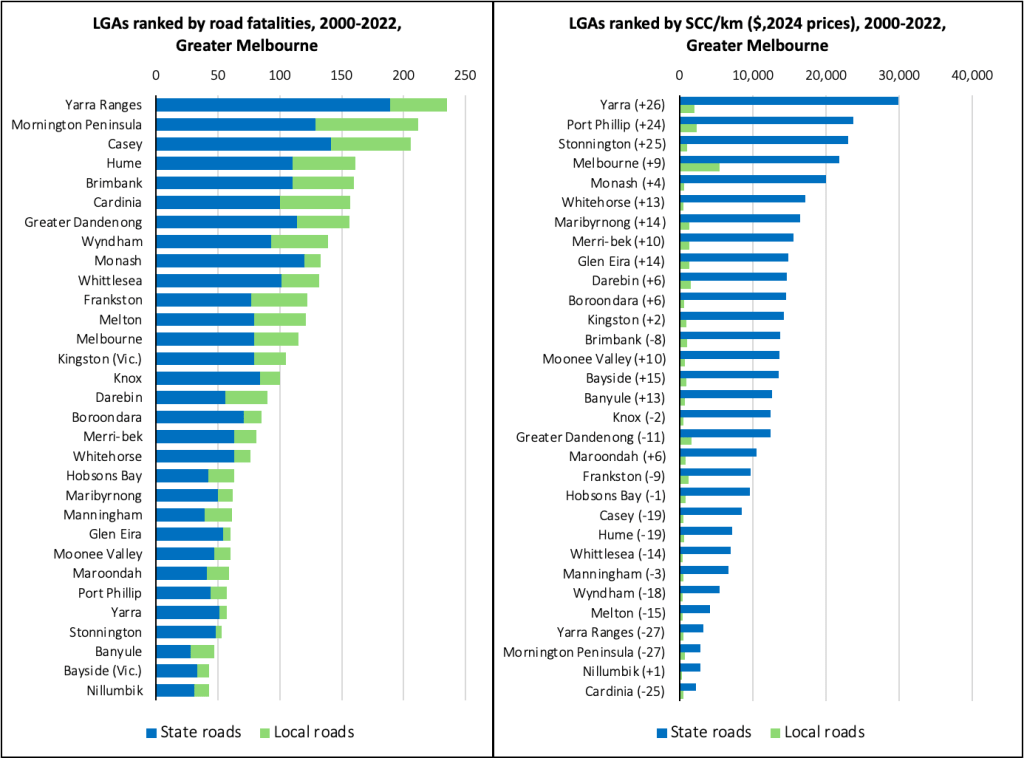
The above graphs show that State roads in Greater Melbourne are much more hazardous than local roads, both for fatalities and SCC. However, using a measure of SCC per kilometre of road changes the ranking considerably, and illustrates why using fatalities as a strategy and policy determinant can be misleading.
Clearly, inner-city LGAs have much higher SCC/km than those further out, and also the SCC/km of State roads is much higher than for local roads. Given that inner-city roads carry much larger proportions of non-motoring road users (particularly pedestrians and bicycle users), directing road safety initiatives to these areas can have much more impact on reducing SCC than only looking at fatalities.
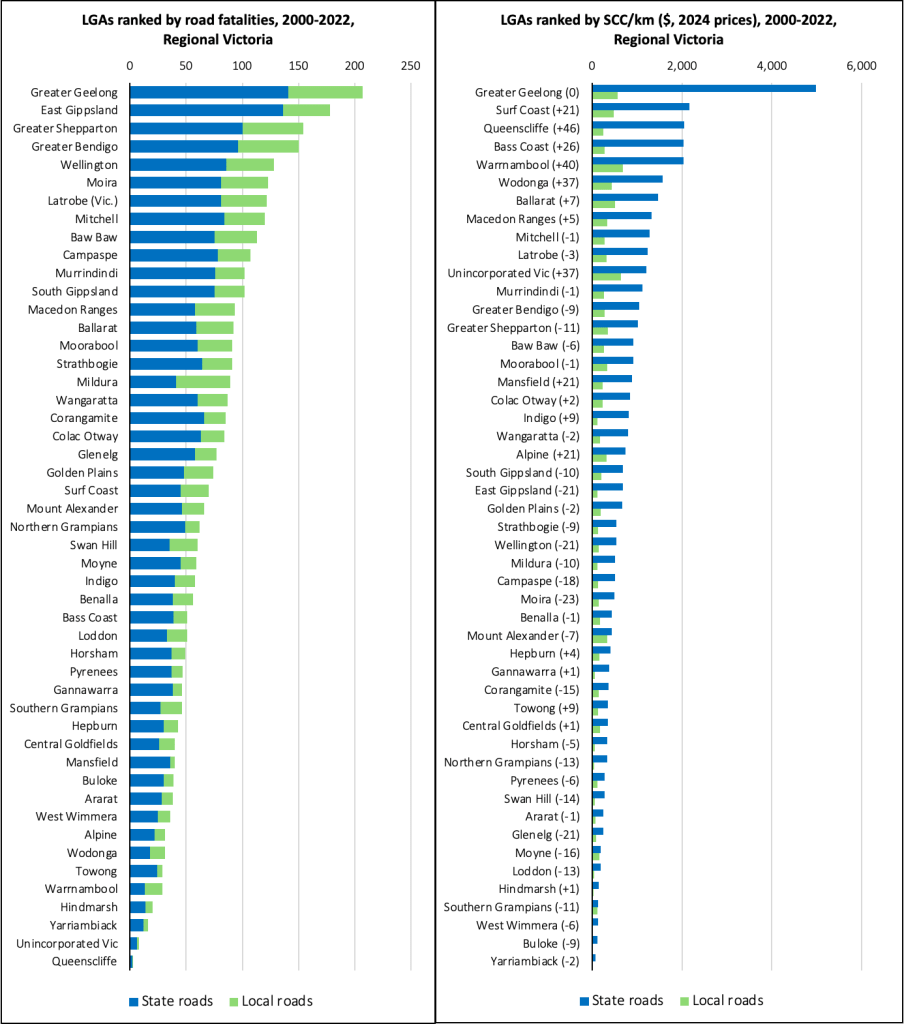
In regional Victoria, looking at SCC/km as an indicator puts LGAs closer to Melbourne (and more urbanised LGAs) higher in the ranking than fatalities, while State roads incur much more SCC/km than local roads (although the difference is not as great as it is in Greater Melbourne). Not surprisingly, Geelong’s SCC/km is much closer to LGAs in Melbourne than regional Victoria.
Conclusions
The concentration on fatalities as the driver of crash reduction policy ignores the much higher social cost of serious injuries, which are much more common and also more concentrated in Melbourne and urban centres than in rural regional Victoria.
Despite being the majority of the network by length, local roads incur much less of the road safety impact than State roads.
Much greater priority should be given to road safety on State roads in Greater Melbourne –especially the inner city – where social costs are highest and involve more diverse road user groups than motorists alone. The fact that fatalities are 22% higher in regional Victoria (they were 25% lower in 2000) should not detract from the need to focus on Melbourne as well.
What policies should be pursued?
It’s beyond the scope of this post to go into detail – and CrashStats is not the best dataset to pursue it – but apart from the continuous need to ensure that drivers are within the law on alcohol, drugs and driver distraction, I’d suggest that:
- continued efforts to provide competitive alternatives to driving – especially public transport – could be effective, especially in inner city areas where congestion and the greater presence of vulnerable road users is evident, but also in areas where people have little choice other than driving
- reducing speed limits would probably be more effective in built-up areas – again particularly in the inner parts of cities – than in rural areas (subject always to setting limits that are appropriate to road conditions)
- there’s separate evidence that vehicle condition and capability is also a significant factor (unfortunately not from CrashStats). I’ve often wondered why Victoria (and indeed Queensland) don’t introduce annual roadworthy certification as in other states. Older, poorly maintained vehicles are a common sight, especially (but definitely not exclusively!) in regional areas
- historically, crash analysis and planning for roads have used a crash rate (usually the number of crashes per million vehicle-kilometres). This inherently trades off traffic throughput against safety (a road with a lot of traffic can seem safer) and also reduces the perceived importance, because the crash rate is typically a small number (a high crash rate is about 0.5 crashes per million vehicle-km!). In this article I’ve consciously avoided expressing crashes relative to traffic volume; I think policy makers and analysts should do the same.
There are lots of other possibilities to address the huge social cost of road trauma; there are plenty of initiatives that produce good results, but I fear we don’t give them anywhere near enough consideration in Victoria, nor anywhere else in Australia, for that matter.
Feel free to add your thoughts and comments below.


Leave a comment